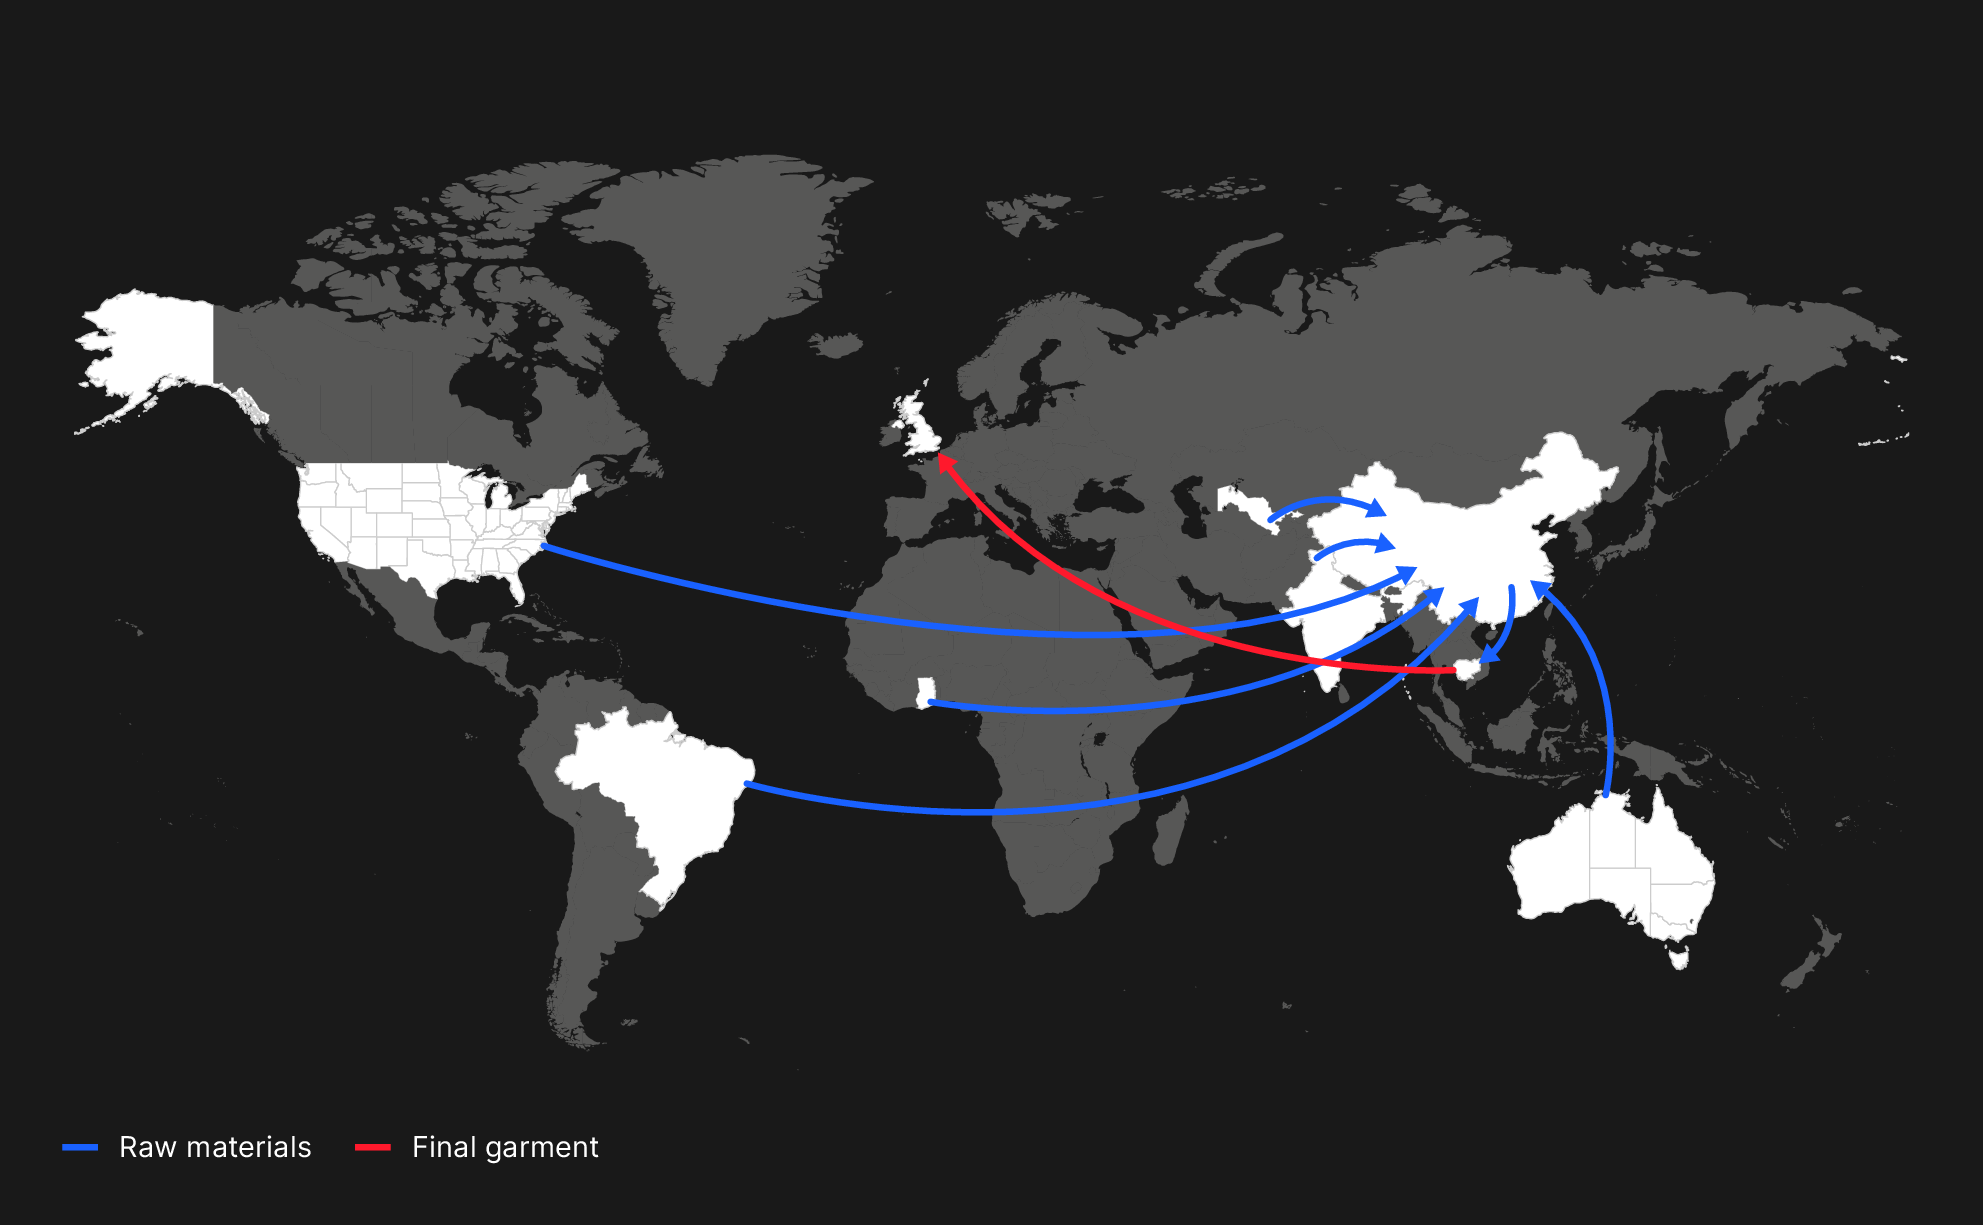
Dr Laurie Parsons, Lecturer in Human Geography at Royal Holloway, University of London, and colleagues from The Disaster Trade research project created this visualisation showing the length and complexity of the supply chains that make the clothes that we use in the UK. Here, Laurie discusses why the visualisation was created, the data that was used to create it and the impact it has had in public and policy settings.
Explainer
 We’re now in a situation where the tools we use to measure the impacts of our industry are no longer really appropriate for the globalised world in which we live. We don’t have the tools to be able to track all of these long distance complex impacts through the supply chains and we don’t measure environmental impacts on that basis, which in our view we very much should.”
Try it yourself
Laurie advises that, for a project like this or any research, it is important to let the data and context on the ground drive your methods and inform how best to communicate your findings to different audiences. He also strongly advocates for working with collaborators and that academic researchers working with non-academics, such as graphic designers and photojournalists, is an effective way to develop new and creative visual ideas to communicate new findings.
You can find out more about The Disaster Trade on the project website and by following their Twitter account @disastertrade
About the creator
Dr Laurie Parsons is a Lecturer in Human Geography at Royal Holloway, University of London and Principal Investigator of The Disaster Trade project. Previously Co-Investigator of the globally reported project Blood Bricks, Laurie’s work explores the contested politics of climate change on socio-economic inequalities, patterns of work and mobilities. It has been published in leading academic journals and respected international media sources, as well as informing the environment and trade policy of companies, governments and international NGOs.
You can find out more about Laurie’s work on his university profile and by following him on Twitter @lauriefdparsons